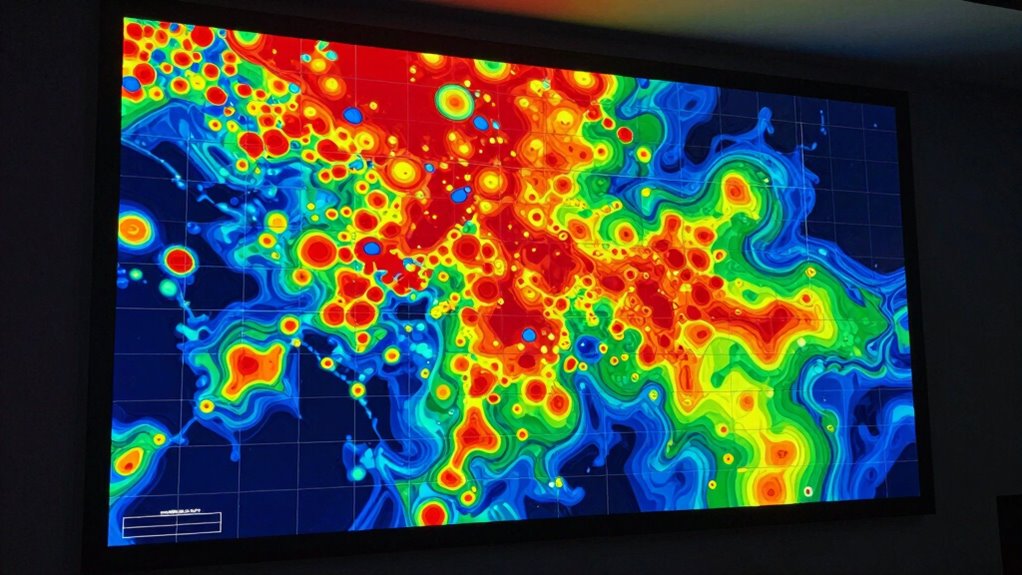
Interactive Tools Incident Pattern Heatmap: See Escalation Trends at a Glance An incident pattern heatmap helps you quickly spot escalation trends and hotspot… The Dark Psychology TeamMarch 7, 2026 View Post
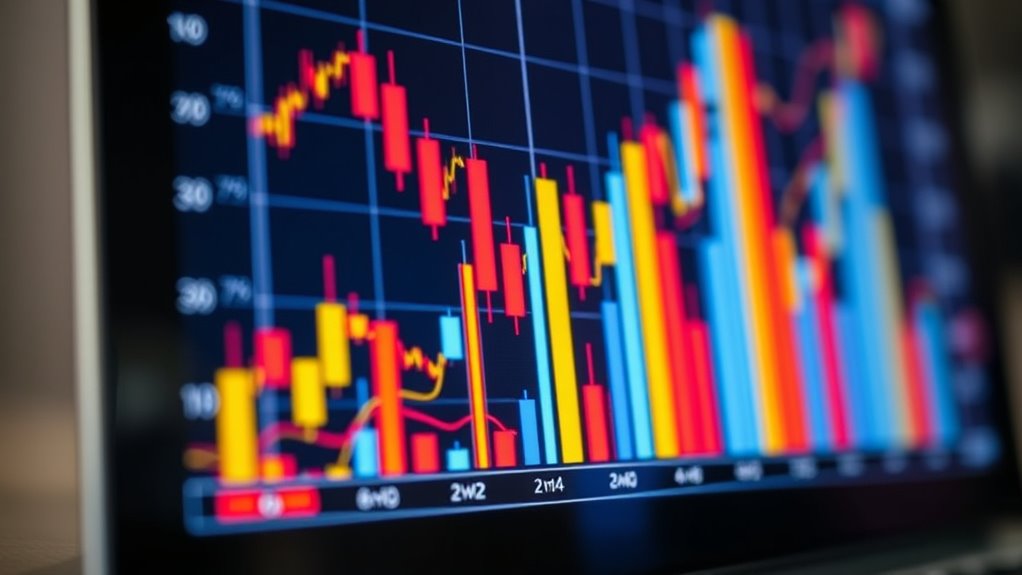
Gaslighting & Manipulation Visual Manipulation: Misleading Graphs & Charts Fascinating visual tricks in graphs and charts can distort data and influence perceptions—learn how to identify these deceptive strategies. The Dark Psychology TeamNovember 23, 2025 View Post